Product categorization with machine learning
Questionmark provides information on sustainability and health of (food) products in the supermarket. Right now, we are able to analyze about 40k products (fully or partially).
In past years, a lot of manual work was needed to type over details from photos (like name, brand, nutrients, ingredients), and to link them to concepts we have data for (researched ingredients, specific nutrients, etc.). But to keep information up-to-date, and to be able to add new products when they become available, we’re gradually moving towards an automated pipeline.
One important step is product categorization, which is used for different purposes:
- Assigning a health group, so that the applicable health score can be calculated (46).
- Assigning a sustainability comparison group, to provide meaningful scores (11).
- Assigning a reference product (from NEVO), for fallback values and extra information (2.2k).
- Browsing on the website (220 leaf categories in max. 5 levels).
- Filtering in QMi Dashboard
Internally we have one taxonomy (1.4k leaf categories in max. 6 levels), other taxonomies are derived from that (except the reference product). Assigning this taxonomy is something to automate, using machine learning.
Prior work
Thankfully, we are not the first attempting to derive a taxonomy from product info using machine learning:
-
Large-scale Multi-class and Hierarchical Product Categorization for an E-commerce Giant (Cevahir and Murakami (2016)) for Rakuten.
deep belief nets + autoencoders, 175M products, 28k leaf categories in 5 levels, 81% accuracy -
Everyone Likes Shopping! Multi-class Product Categorization for e-Commerce (Kozarva (2015)) for Yahoo!.
neural network embedding, 450k products, 320 leaf categories in 6 levels, 0.88 f-score -
Chimera: Large-Scale Classification using Machine Learning, Rules, and Crowdsourcing (Sun, Rampalli et al. (2014)) for Walmart.
rules + kNN + naive Bayes + perceptron + crowdsourced evaluation, 14M products, 5k categories, 93% classified with 93% precision -
Applying Machine Learning to Product Categorization (Shankar and Lin (2011)) on two Amazon catalogs.
tree classifier or naïve Bayes, 5k products, 21 categories in a flat hierarchy, 86% and 80% accuracy respectively
Some keywords are: (hierarchical) product categorization, document classification, subject indexing.
There’s also catalog integration (Priya and RangaRaj (2013)), which is about integrating an existing taxonomy into a different target taxonomy. As we may have some external taxonomy information, this also applies.
Conclusion: there are different approaches, with several options for pre-processing and classifiers. To achieve an accuracy of 90% or more, one needs more than just machine learning. The order of magnitude we’re at seems ok, though we might run into not having enough training data.
Input fields
An example (unprocessed) product may look like the following:
{
  "name": "Hutspot (gesneden)",
  "unit": "400 g",
  "brand_name": "NL Hutst",
  "description": "<p>Met deze gesneden hutspotgroenten zet je in een handomdraai een heerlijke hutspot op tafel. Het schillen en snijden is al voor je gedaan; je hoeft ze alleen nog samen met de aardappels te koken en op smaak te brengen zoals jij lekker vindt.</p>",
  "preparation": null,
  "origin": "Nederland",
  "ingredients": ["Peen* 70%", "Ui* 30%", "* = biologisch"],
  "allergens": ["Vegetarisch", "Veganistisch", "Sojavrij", "Eivrij"],
  "certifications": ["EKO"],
  "categories": ["AGF", "Groente"]
}
From our current, manual data entry process, we know:
- Name is enough in most cases.
- Name and brand are almost always available.
- Category can be present, but may or may not be specific enough.
- Description often contains distinguishing information if name isn’t clear enough.
- Ingredients may play a role to distinguish between processed and unprocessed vegetables or fish.
- Storage or refrigeration might be important for frozen, cooled or fresh variants (often also in description).
- Package might be relevant to distinguish between canned and fresh (often also in description).
- Images are often also used (but we’ll ignore them for now).
Category mapping
You may have noticed that there is a Category field in the source data. In many cases, there is a mapping from these source categories to our destination category. Currently we have a manual mapping for this. But sometimes the source category is too broad, or missing altogether. So the classifier needs to work whether the source category is present or not.
Thus we’ll train without considering the source category. On classification of new products, we look both at the classifier and the manual mapping. Depending on specificity and probability, we’ll choose one. This is somewhat similar to how Sun, Rampalli et al. (2014) integrates rules and classifiers (but in our case the same product may appear with and without source category, so when the mapping rules apply, we still want to train other fields).
If different approaches, like multiple hierarchical classifiers, are explored, this can be reconsidered.
Concept prototype
Orange is a visual programming tool for machine learning. It’s useful for creating a basic prototype. Starting from a spreadsheet, the orange3-text add-on transforms this into a list of tokens for each row. Each word becomes a feature (present or not). Testing four different classification algorithms, SVM comes out as winner and random forest a close second.
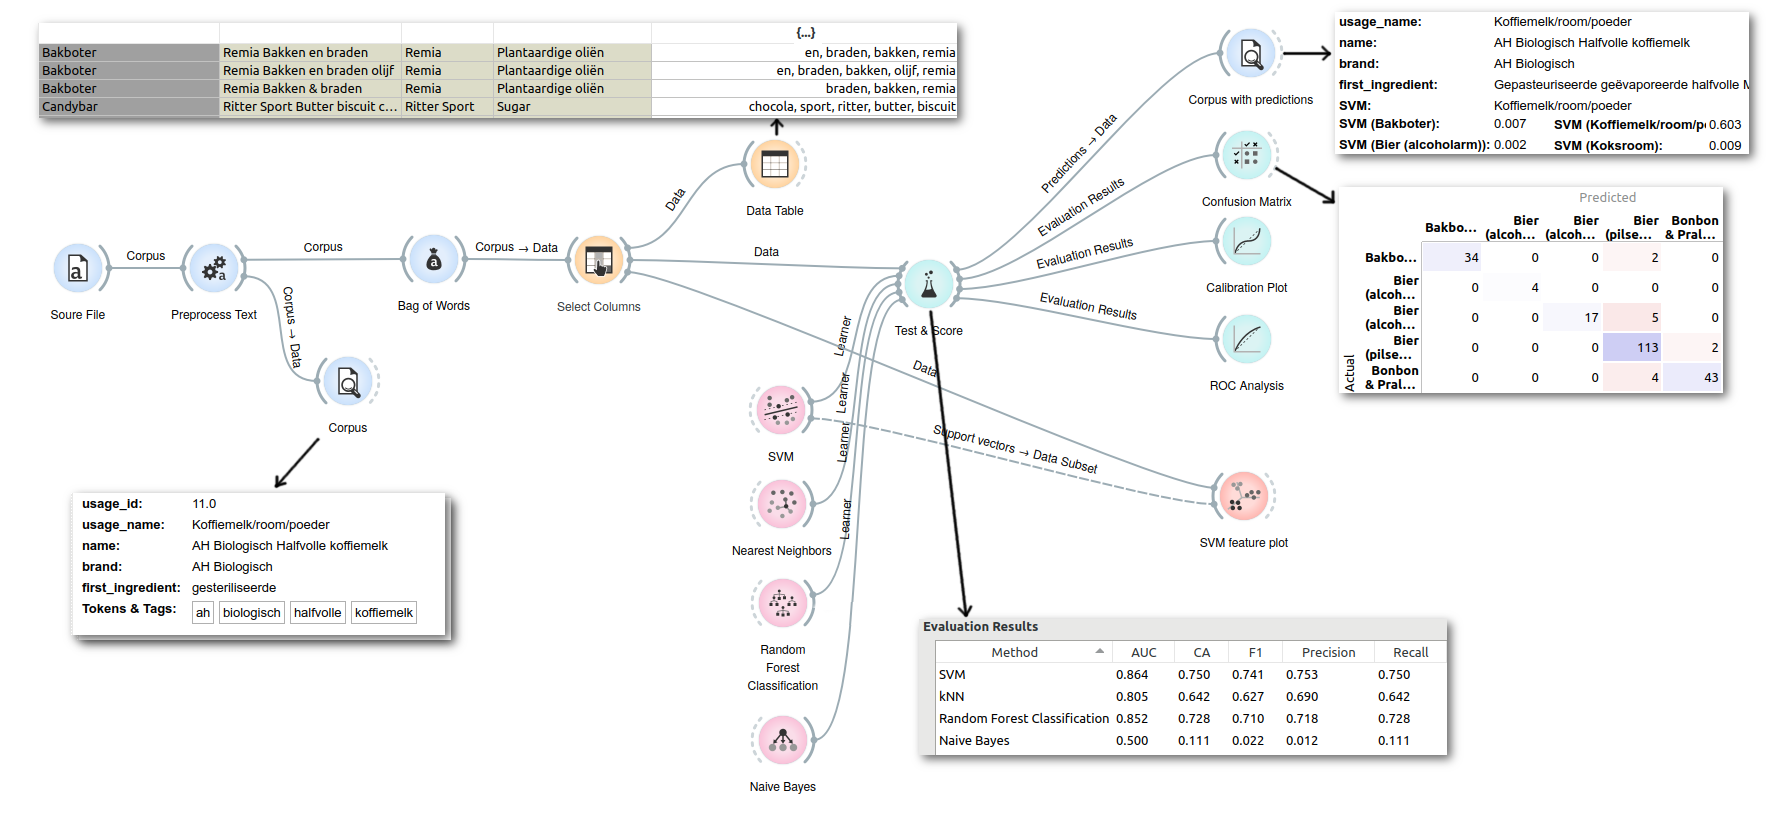
You can open the orange workflow
with a data sample
to experiment yourself. You may need to select usage_name as target variable in Select Columns.
75% precision on this small dataset isn’t a bad start at all.
Real data prototype
To get a better idea of how this would perform in reality, another prototype was created in Ruby (because that’s what we’d like to use for the final application).
See classify.rb and the README for actual code (which can use the same example data as the concept prototype).
Feature extraction
Basic pre-processing like lower-casing (except for brand), removing punctuation, transforming accented characters, and removing stopwords is done. If a percentage is present in the name, that’s extracted as a separate continuous feature (scaled to 0-1). If the name starts with brand, it’s removed to avoid duplicate features.
Subsequently, brand is used as a token in itself, while for name and first_ingredient each word becomes its own token (boolean, indicating presence - for these short sentences counting doesn’t make sense). To keep distinction between different fields, each token is first prefixed with a field-identifier (inspired by Chen and Warren (2013)).
Other things to consider are stemming (Sun, Rampalli et al. (2014)), using word frequency (Chen and Warren (2013)) after all, and removing numbers (Shankar and Lin (2011)). And what about n-grams?
Finding optimal parameters
What features help in getting a better accuracy? What is the influence of SVM parameters? This section shows a non-exhaustive search for a suitable choice. Tests are done using libsvm 3.22.
Datasets: shorter consists of 1049 products in 39 categories, short has 2074 products in 60 categories, and large contains 18326 products in 1044 categories. During feature selection, only words that occured three times or more in the dataset were selected as features. Final results use the large dataset.
Radial kernel
Initial tests were performed with a radial kernel, which has two problem-specific parameters C and g.
A grid search was performed using svm-grid on the short(er) dataset, resulting in C=128 and
g=0.125. This is probably different for the large dataset, but doing a grid-search on that would
take a lot of time.
The best result is obtained with attributes percentage, name, brand and first_ingredient, with an accuracy of ~60%, and training in the order of quarter hours. The result is questionable, as the number of features becomes way too large (same order of magnitude as number of training samples).
Radial SVM cross-validation for different features (expand)
$ time svm-train -c 128 -g 0.125 -v 5 data.train data.model
| dataset | pct. | name | brand | 1st ingr. | ingr. | desc. | words | features | train | accuracy |
|---|---|---|---|---|---|---|---|---|---|---|
| shorter | x | x | 315 | 1s | 74.5% | |||||
| shorter | x | x | x | 409 | 1s | 77.7% | ||||
| shorter | x | x | x | x | 409 | 1s | 77.8% | |||
| shorter | x | x | x | x | x | 409 | 1s | 77.8% | ||
| short | x | x | x | 759 | 4s | 74.3% | ||||
| short | x | x | x | x | 759 | 4s | 74.0% | |||
| short | x | x | x | x | 1537 | 5s | 61.5% | |||
| short | x | x | x | x | x | 3386 | 12s | 46.6% | ||
| large | x | x | 3758 | 15m | 59.2% | |||||
| large | x | x | x | 4886 | 18m | 60.4% | ||||
| large | x | x | x | x | 4886 | 13831 | 19m | 60.3% | ||
| large | x | x | x | x | x | 15719 | 34m | 30.7% |
In these experiments there percentage was not scaled, resulting in lower accuracy instead of higher.
Note that about half of the tests was also done using libsvm_threads of Dec 2014, but consistently took an order of magnitude more training time using 4 CPUs. Better stick to the original, single-threaded, version.
Linear kernel
For document classification, a linear kernel is usually good enough. This allows for a much more efficient algorithm, which is implemented by liblinear. The best result is obtained by using linear SVM with fields percentage, name, brand and first_ingredient, with an accuracy of ~60%, and training in the order of minutes.
Linear SVM cross-validation for different features (expand)
$ time liblinear-train -v 5 data.train data.model
| dataset | pct. | name | brand | 1st ingr. | ingr. | desc. | words | features | train | accuracy |
|---|---|---|---|---|---|---|---|---|---|---|
| shorter | x | x | x | 409 | 326 | 0s | 79.3% | |||
| shorter | x | x | x | x | 409 | 324 | 0s | 79.2% | ||
| short | x | x | x | 758 | 584 | 0s | 76.6% | |||
| short | x | x | x | x | 758 | 580 | 2s | 76.8% | ||
| large | x | x | 3758 | 4504 | 40s | 61.9% | ||||
| large | x | x | x | 3758 | 4498 | 67s | 61.9% | |||
| large | x | x | x | x | 4886 | 2845 | 97s | 63.4% | ||
| large | x | x | x | x | 14153 | 3096 | 83s | 60.6% | ||
| large | x | x | x | x | 17384 | 868 | 150s | 61.9% |
Facilitating a more in-depth look
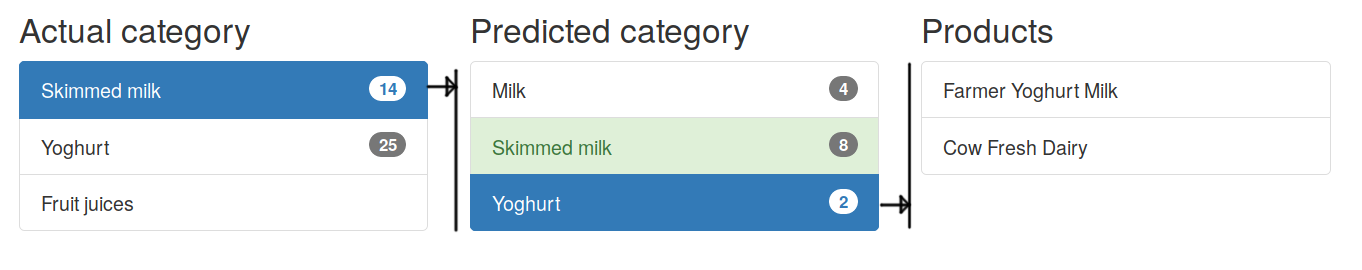
The input data (manually assigned categories) isn’t perfect. Neither is the feature extraction. Improving the results can be done by looking at misclassifications and understanding why it happened. A confusion matrix can be helpful here. Yet with a thousand categories, this becomes a little unwieldy.
One approach would be to show a list of categories, of which one can be selected. The selected category then shows misclassifications to and from. Selecting a classification could show the instances.
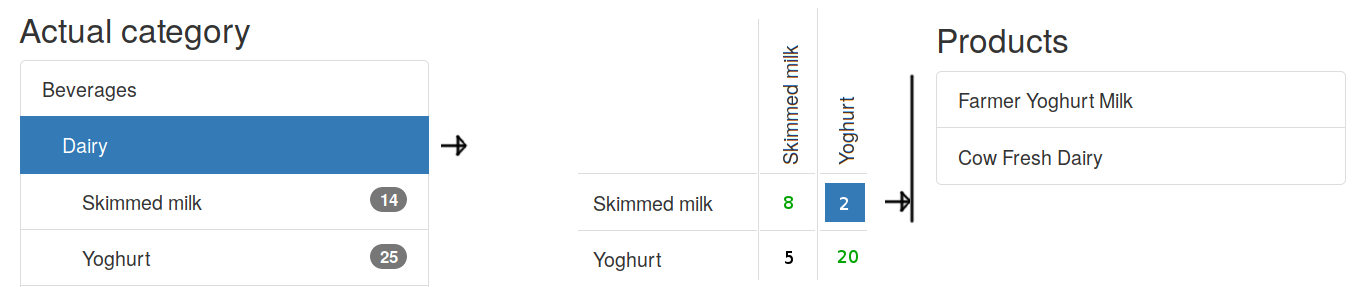
For the case of a hierarchical category tree, another option would be to look at portions of the matrix grouped by parent category. The matrix shows actual categories in the left, and predicted categories on top, providing a clear overview of where misclassifications occur. An open question remains how to show misclassifications outside the parent category.
Future improvements
- Rule-based classifiers, like whitelist and blacklist (in Sun, Rampalli et al. (2014), section 4.5).
- Ask data entry people which specific words in the description may be important, and try adding those.
- Try separate classifiers for parent categories and their children (e.g. Liu, Yang et al. (2005) and Cai and Hofmann (2004)).
- Look into combining different mechanisms using boosting.
- Try decision tree algorithm(s) on real data.
- Experiment with more features, like (normalized) unit, allergens, and others.
Conclusion
We’re going to build category classification using linear SVM into our systems, combined with manual rules, and take the best. Availability of probability from the classifier could potentially be a big help to detect - and solve - misclassifications.
Thanks for reading this far, I hope it’s been useful. If you have any comments (or see any errors), feel free to contact me or us.
References
(in order of relevance per topic)
Machine learning & classification
-
Sebastiani (2001): Machine Learning in Automated Text Categorization. Good and extensive overview of the field.
-
Masood (2016): The Elusive Search of Approachable Taxonomy for Machine Learning Algorithms. For finding the right algorithm, with the help of scikit-learn’s, Azure Machine Learning and Dlib’s diagrams.
-
Costa, Lorena et al. (2007): A Review of Performance Evaluation Measures for Hierarchical Classifiers. Explains accuracy, recall, precision and more.
Product categorization
-
Sun, Rampalli et al. (2014): Chimera: Large-Scale Classification using Machine Learning, Rules, and Crowdsourcing.
-
Kozarva (2015): Everyone Likes Shopping! Multi-class Product Categorization for e-Commerce.
-
Cevahir and Murakami (2016): Large-scale Multi-class and Hierarchical Product Categorization for an E-commerce Giant.
-
Priya and RangaRaj (2013): Taxonomy aware catalog integration with Hidden Markov Model (HMM).
-
Shankar and Lin (2011): Applying Machine Learning to Product Categorization.
Related work
-
Ristoski, Petrovski et al. (2016): A Machine Learning Approach for Product Matching and Categorization. Attribute extraction and unsupervised category matching, targeted to webshops.
-
Liu, Yang et al. (2005): Support vector machines classification with a very large-scale taxonomy.
-
Cai and Hofmann (2004): Hierarchical Document Categorization with Support Vector Machines.
-
Chen and Warren (2013): Cost-sensitive Learning for Large-scale Hierarchical Classification of Commercial Products. (presentation)

